We continue our series of articles on quant trading and the related concepts. This time we will look into the is statistical arbitration — a variation of pair trading.
The main idea is in identification of trading instruments that have similar movements on the market. As the deviation of one of the instruments is formed — an assumption is made that this deviation will be fixed by the market participant. We can recognize such a deviation if we know the absolute fair price value of the trading instrument. That is relatively hard to accomplish.
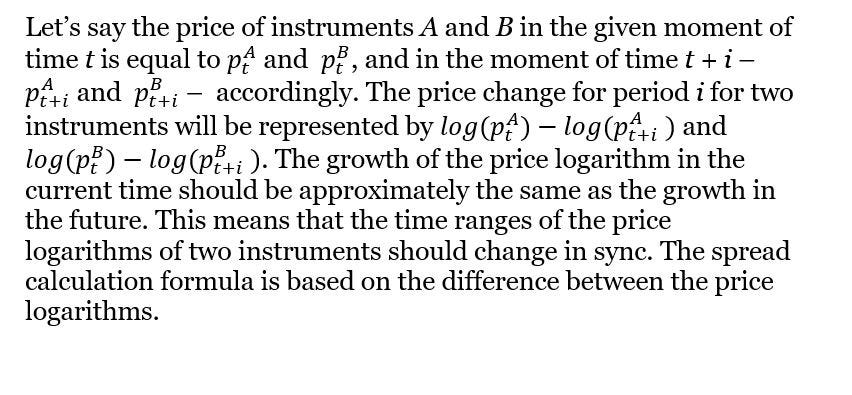
The statistical arbitration, in turn, uses the idea of relative price forming. So if two stocks have similar characteristics, the price forming trend will be more or less the same for both of them. The specific instrument price then does not matter. The price may not have a fair value. What’s important is for the price change dynamics of two instruments to be the same. If in certain time periods the dynamics is different, then one instrument is overvalued and the other — undervalued.
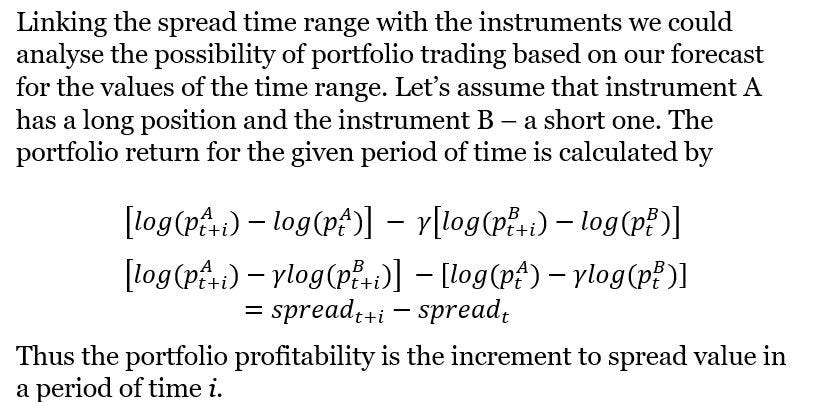
Pair trading suggests selling the overvalued instrument and the purchase of the undervalued one expecting that the given spread will be fixed in the future. The higher the spread the higher the potential profit.
The main task in is finding the pairs of instruments. The theoretical explanations of instrument price synchronization come from arbitrage pricing theory (APT). According to APT if two stocks have equal risks, then the expected will also be equal. Yet the actual profit can slightly vary due to the different profit margin of the instruments
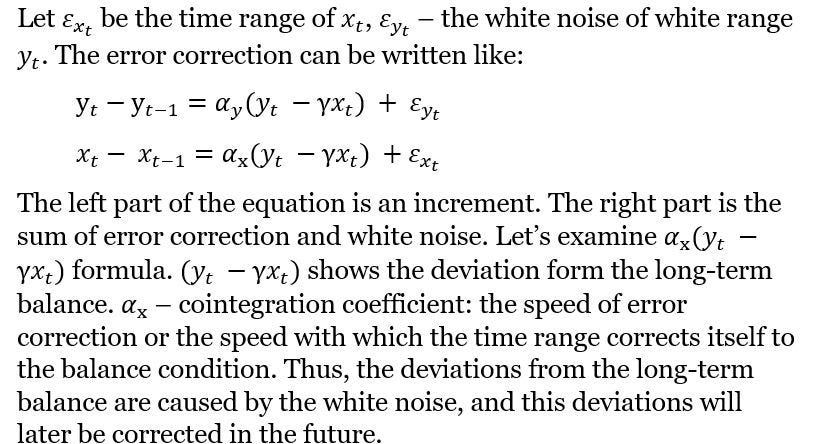
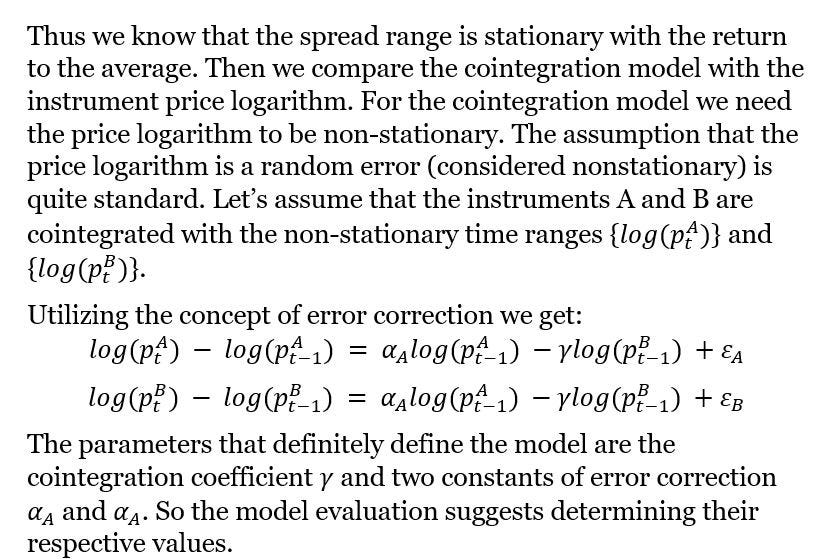
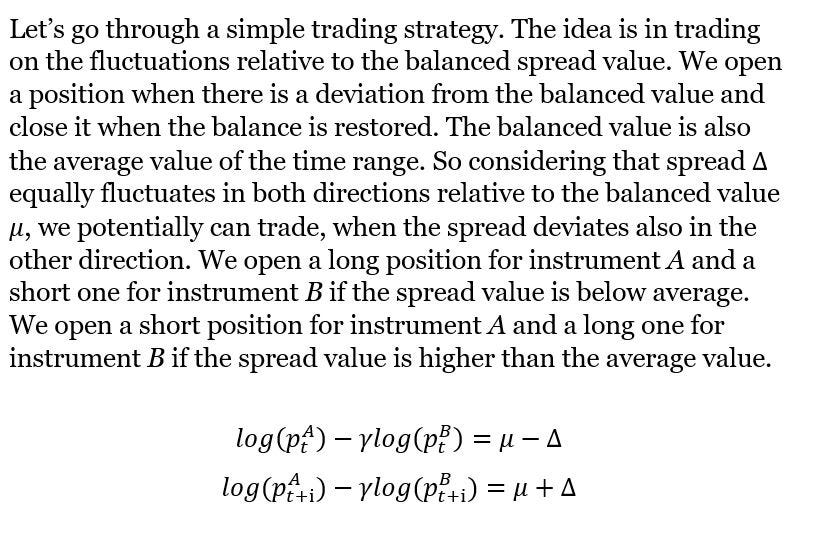
The synchronicity of instrument movement is based on cointegration. The idea of cointegration suggests that if two time rages are non-stationary that in certain situations their specific linear combination is in reality stationary. Let’s put this concept in the formula.
For the development of the full-fledged trading strategy it is necessary to identify the pairs of trading instruments based on the fundamental data or on the statistical approach by studying the historical data. Next, we check the hypothesis that the pairs are really united on the basis of statistical data from the archive. This includes determining the cointegration coefficient and studying the spread time ranges to confirm that the spread is stationary with the return to average. Afterwards we study the cointegration pairs to determine the delta.
More areas of algorithmic trading will be covered in our next articles. Make sure to check out our Whitepaper for further details.




Comments
Post a Comment